This tutorial will show you how to view reliability history for your Windows 11 device.
The Reliability Monitor provides a system stability overview and details about events that impact reliability. It calculates the Stability Index shown in the System Stability Chart.
Reliability Monitor maintains up to a year of history for system stability and reliability events. The System Stability Chart displays a rolling graph organized by date.
The top half of the System Stability Chart displays a graph of the Stability Index. In the lower half of the chart, five rows track Reliability Events that either contribute to the stability measurement for the system or provide related information about software installation and removal. When one or more Reliability Events of each type are detected, an icon appears in the column for that date.
- For Software Installs and Uninstalls, an Information icon indicates a successful event of that type occurred, or a Warning icon indicates a failure of that type occurred.
- For all other Reliability Event types, an Error icon indicates a failure of that type occurred.
Based on data collected, each date in the System Stability Chart includes a graph point showing that day's System Stability Index rating. The System Stability Index is a number from 1 (least stable) to 10 (most stable) and is a weighted measurement derived from the number of specified failures seen over a rolling historical period. Reliability Events in the System Stability Report describe the specific failures. For more information about interpreting the System Stability report, see Use Reliability Monitor to Troubleshoot.
- Recent failures are weighted more heavily than past failures, allowing an improvement over time to be reflected in an ascending System Stability Index once a reliability issue has been resolved.
- Days when the system is powered off or in a sleep state are not used when calculating the System Stability Index.
- If there is not enough data to calculate a steady System Stability Index, the graphed line will be dotted. When enough data has been recorded to generate a steady System Stability Index, the graphed line will be solid.
- If there are any significant changes to the system time, an Information icon will appear on the graph for each day on which the system time was adjusted.

Reliability Monitor shows no information - Windows Server
Describes a behavior that is by design in Windows Server 2008 and in Windows Server 2008 R2. This behavior causes no information to be displayed in Reliability Monitor.
docs.microsoft.com
Use Reliability Monitor to Troubleshoot
docs.microsoft.com
Here's How:
1 Open the Control Panel (icons view), and click/tap on the Security and Maintenance icon.
2 Expand open Maintenance, and click/tap on the View reliability history link to open Reliability Monitor (perfmon /rel). (see screenshot below)
3 Reliability Monitor will now start generating the report. (see screenshot below)
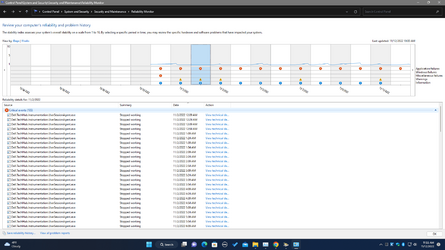
7 After a short moment, you will see the reliability and problem history for your Windows device. (see screenshots below)
8 You can select how to View by (ex: "Days" or "Weeks") the history line graph.
9 You can click/tap on the back and forward arrow buttons to scroll through the history line graph.
10 You can click/tap on View all problem reports at the bottom to see them all at once instead of on the line graph.
11 You can click/tap on a problem in the timeline to its details at the bottom.
12 You can click/tap View technical details for a problem source to see more details about it.
13 You can click/tap on Save reliability history at the bottom to save the reliability history as an .xml file to a location you select.
That's it,
Shawn Brink
Last edited:
")
") which is different from learning things out of concern that they might go wrong
which is different from learning things out of concern that they might go wrong ")